Where was the demonstration implemented?
The second demonstration and training activities of SAFERS were performed on February 9th, 2023 in Piedmont in Italy to evaluate the beta version of the project’s dashboard and Intelligent Services (ISs) in a controlled environment. Along with the first demo in France, the event allows for gathering information on the reliability and usefulness of the proposed service in simulated in-field scenarios. The event involved technical entities, first responders, local authorities, and citizens.
CSI organised the SAFERS demonstration in Italy with the support of Piedmont Regional Civil Protection , AIB (Volunteer Forest Firefighting Corps), ARPA and Ipla. CSI is one of the most important Italian tech companies that creates digital services for Piedmontese and other Italian Public Administrations which are daily used by citizens and businesses.
Regarding SAFERS, CSI works close to Piedmont’s Regional Civil Protection and AIB (Volunteer Forest Firefighting Corps) to test SAFERS services and integrate some of them within the volunteer management systems currently used at the regional level.
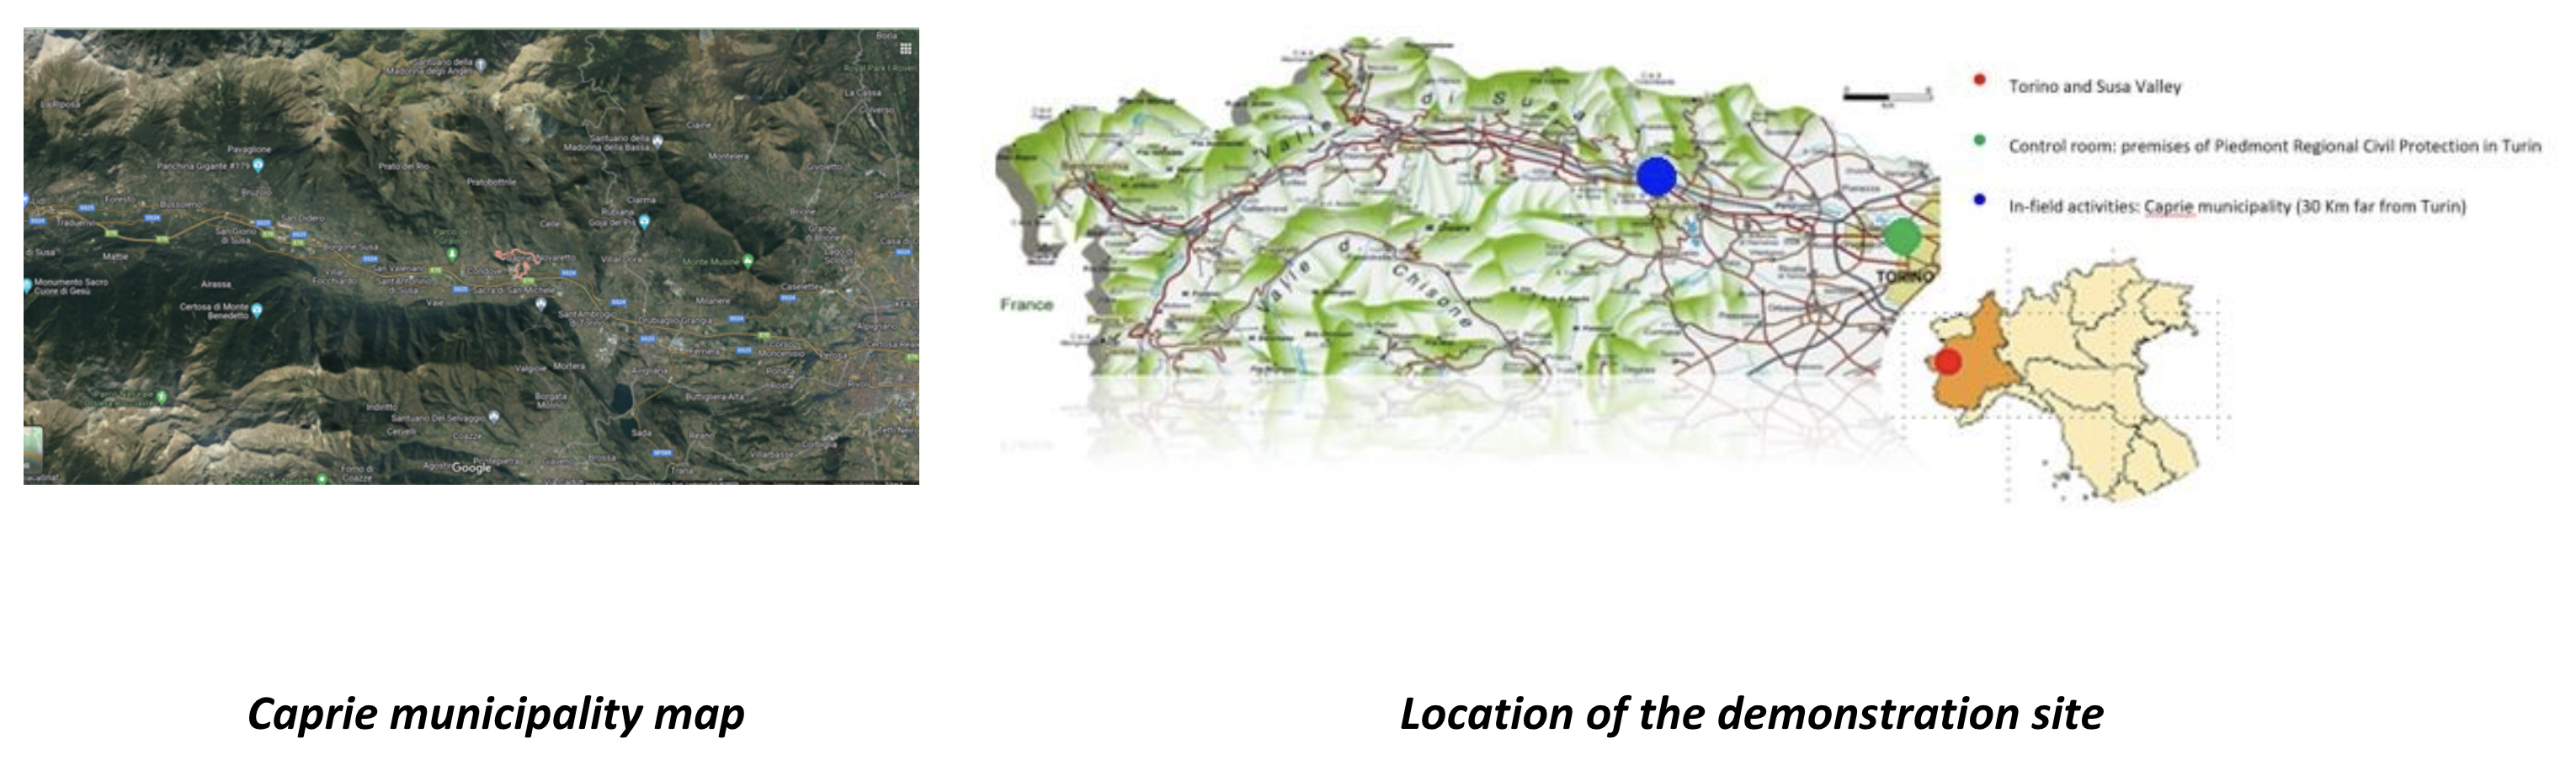 The simulation refers to the big fire of 2017 that affected Peroldrado area that covers 256 hectares of Castanea sativa trees in Caprie municipality, involving about 250 volunteers, 34 vehicles and 1 helicopter. For the demo, we simulate only the moment of restart and the maximum intensity caused by the strong foehn winds, whereas the real wildfire had lasted 15 days.
How did the demonstration go?
- A series of meetings took place during which, the project, the ISs provided and the purpose of the exercise were presented. During these meetings, the case study was chosen, and the script of the exercise day was defined.
- Considering the demo experience in Corsica where participants had difficulty using the Safers chatbot, training meetings were organised for AIB volunteers and citizens before the demo.
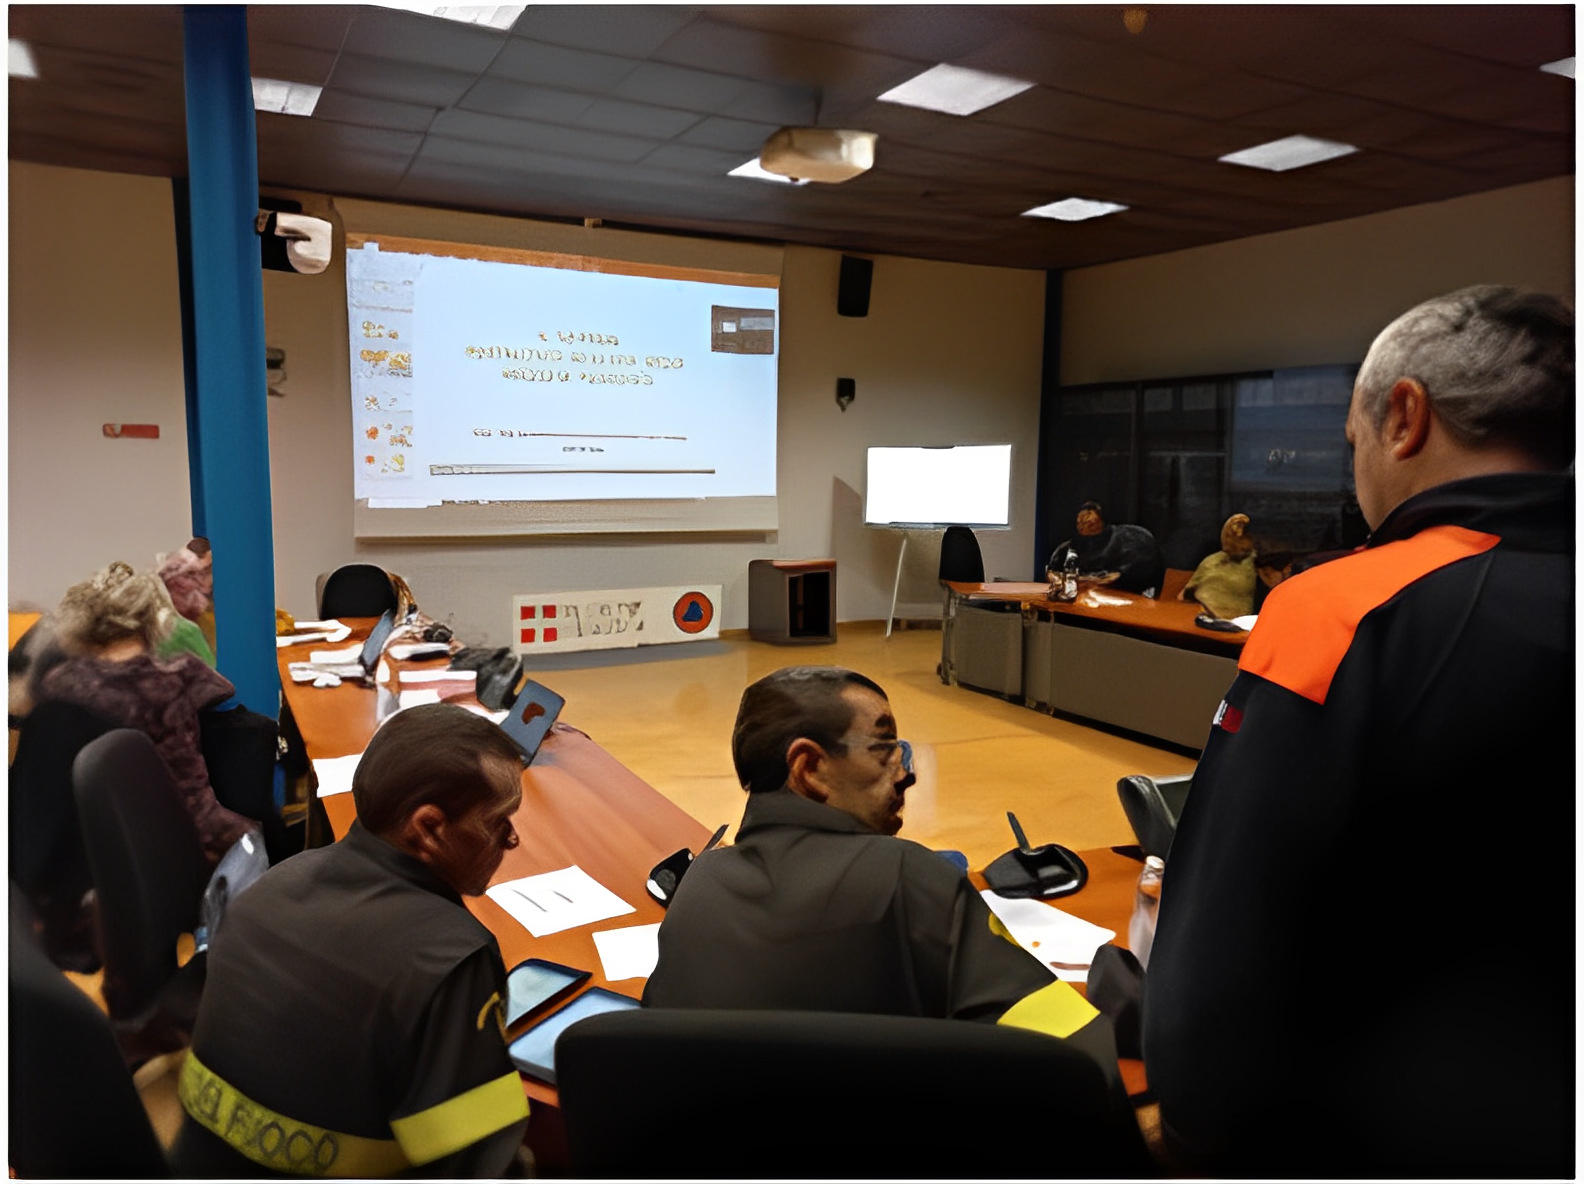
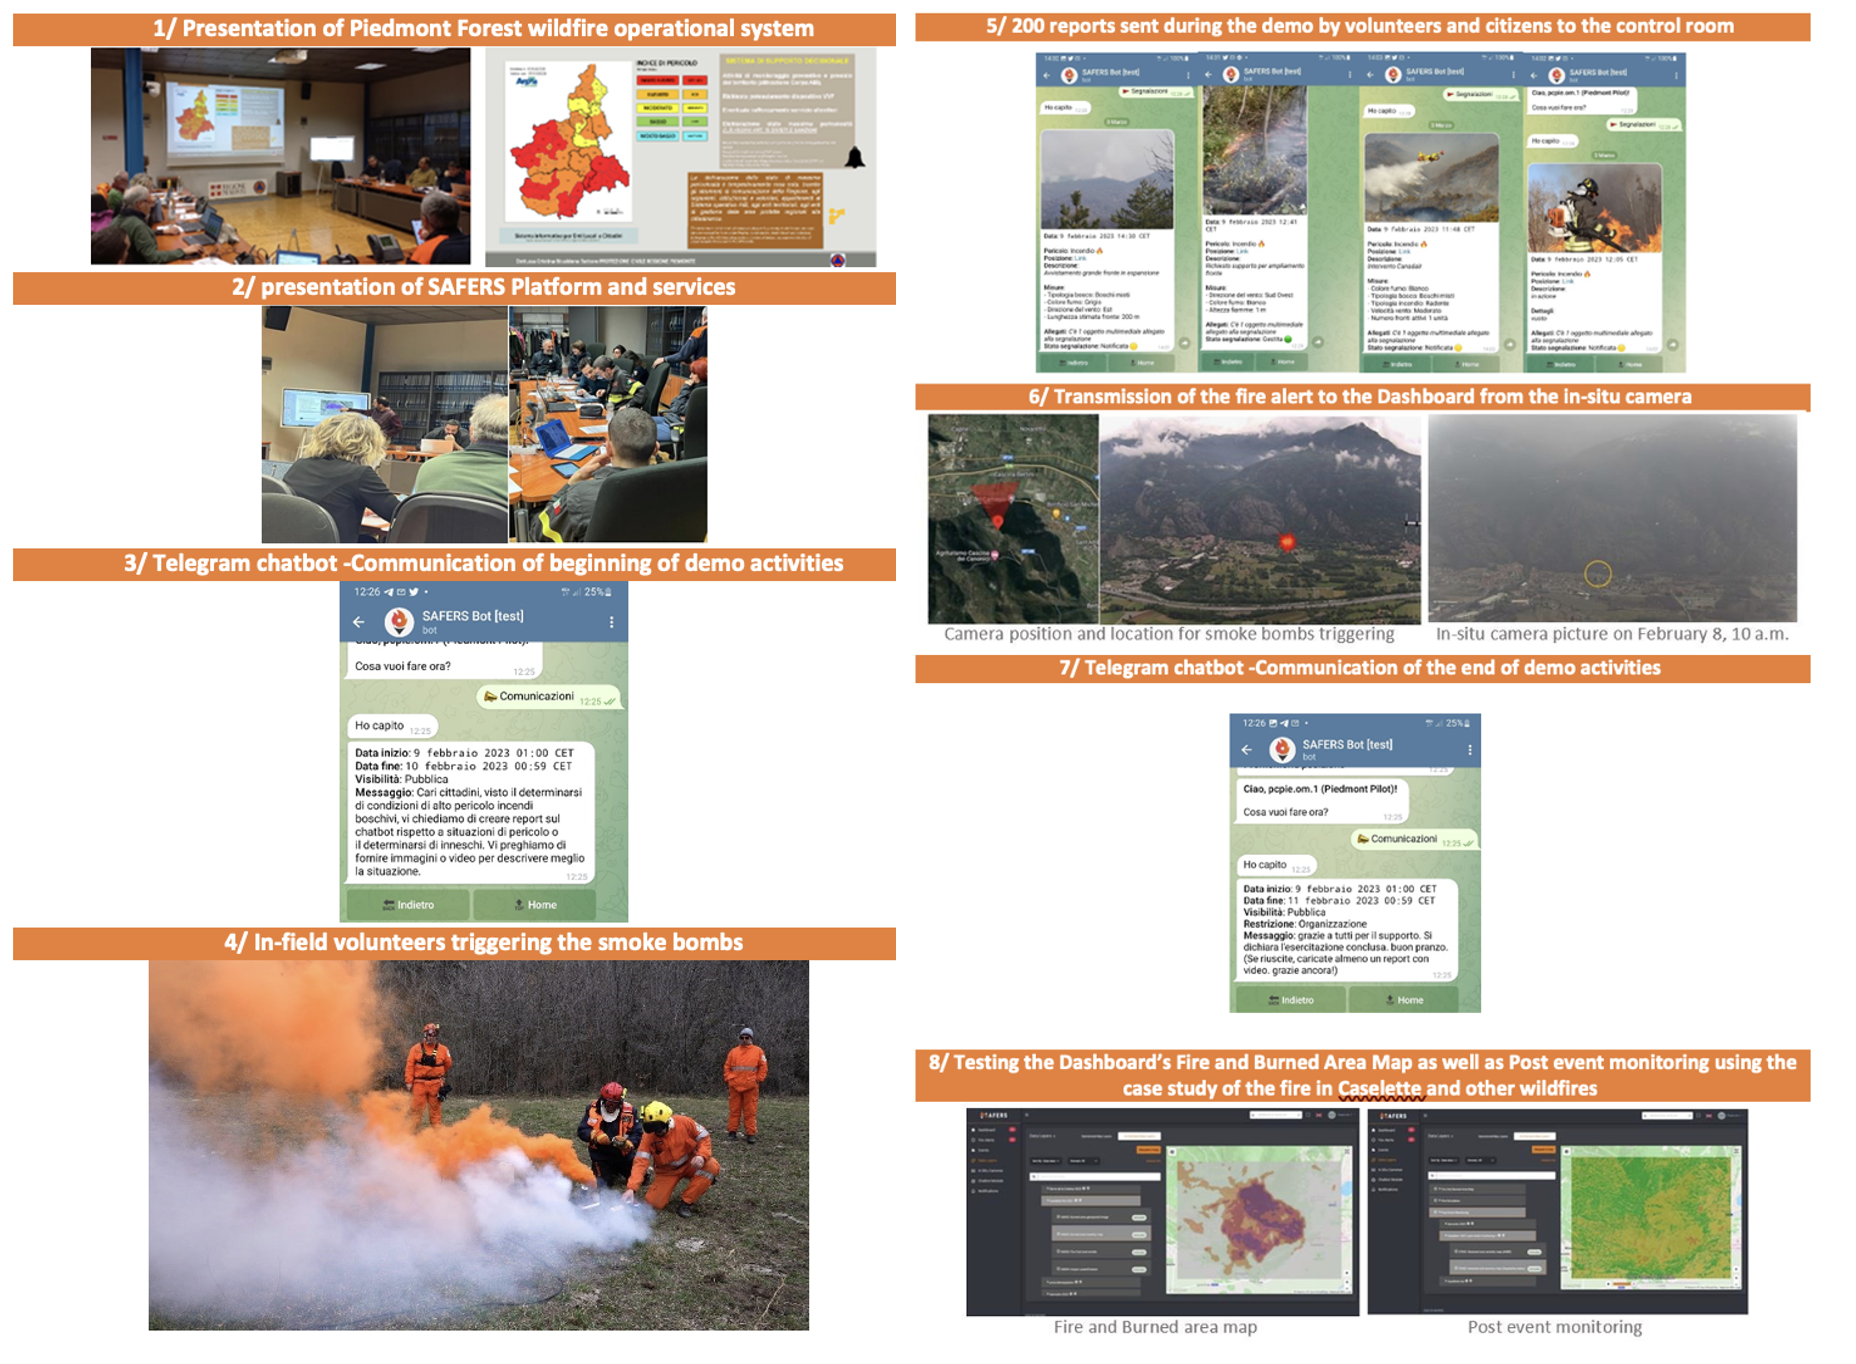
- At the beginning of the demo, Piedmont Civil Protection, AIB, and ARPA briefly described the Piedmont Forest wildfire operational system. Then, all the Intelligent Services and their relevance were presented by the coordinator of SAFERS.
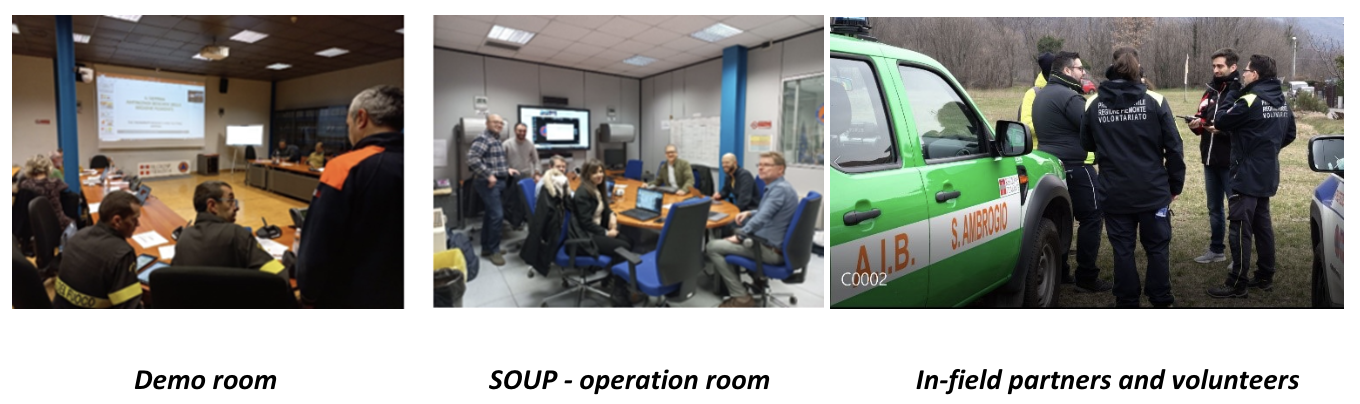
- During the morning of the pilot day, the participants were divided into 3 groups:
- First, Civil Protection, VV.F. and AIB coordinators were involved as decision-makers, supported by a few SAFERS Partners to correctly use and test the SAFERS ISs in the simulated SOUP based at the Fire Department headquarters. External observers were also invited and attended the demo in the soup. In particular:
- ARPA Piemonte, IPLA SpA, DISAFA participated as local (Piedmont) observers.
- Liguria Region Civil Protection, Autoridade Nacional de Emergência e Proteção Civil (Portugal Civil Protection) and Greek Fire Fighters as ‘external’ observers.
![]()
Institutions involved in the Italian pilot site activity
- Second, Other SAFERS partners attended the demo room, specially set up (FMI, RISCOGNITION, CERTH, ASTROSAT, WATERVIEW).
- Finally, Civil Protection of Piedmont Region, AIB (Anti Incendi Boschivi - Forest Firefighters volunteers), ARPA (Agenzia Regionale Per l'Ambiente - Regional Environmental Agency), VV.F (Vigili del Fuoco - Firefighters in the wild-urban interface) and CC.F (Carabinieri Forestale) are the main organizations involved during the in-field demo. A total number of 8 trucks and one AIB mobile operating room were mobilised for the simulation.
- A communication of the beginning of the activities was sent to all citizens in north Italy using the Dashboard’s chatbot module.
- volunteers and citizens had already been trained in using the Chatbot, so on the day of the demo, they logged in to the Telegram bot and shared their location. Upon receiving the start-of-activity notice sent by the control room, they started sending reports. Almost 200 reports were sent to the control room about the critical situation met on the ground while first responders described the fire suppression activities.
- On the Dashboard, the number and location of volunteers in an 'active' status was tracked. SOUP created and assigned monitoring missions to the different volunteer teams, asking them to go to Caprie, send reports from the field. They continued interacting with the control room using the Telegram Chatbot.
- One of the AIB teams was pre-positioned on the field to trigger the smoke bombs to test the in-situ camera.
- The camera didn’t detect the smoke generated by the smoke bombs due to bad weather conditions (snow, fog). Therefore, the alert was directly triggered by Waterview staff. SOUP created then different fire-suppression missions dedicated to each team, asking for reporting the in-field hazard and evaluating to call a helicopter for fire-extinguishing support. In the meantime, a Fire simulation was requested on the Dashboard’s Data Layers. The data collected at the time of the fire from the nearest weather station was entered into the Dashboard.
- With the missions completed, SOUP declared the in-field exercise concluded and sent a communication via Chatbot to notify citizens and volunteers of the closure of operations
- In the afternoon, Dashboard’s Fire and Burned Area Map as well as Post event monitoring were tested, using the case study of the fire in Caselette municipality in March 2021 and other wildfires. The simulation results were compared with the actual effects that could be observed on the field.
What are the main feedbacks?
The qualitative information collected during the event allows a better understanding of the audience's perception. The most appreciated capabilities of the SAFERS Dashboard are the burned area delineation and the on-demand wildfire nowcast and forecast. In addition, the participants highlighted the value of the capability to gather pictures of the territories via in-filed reports.
The participants appreciated the quality and quantity of services providing handy data, potentially supporting different operative phases. Considering the operational needs, they suggested enriching the current data visualisation approach. The beta 1 version of the Dashboard currently includes many data layers, each dedicated to specific data and parameters, accessible by navigating deep menus. The data displayed are relevant but would be even more helpful for Control Room Operators if made available in combined layers. Accessing and handling different information types simultaneously would be especially crucial during the preparedness and response phases, when the users have to manage complex situations related to people, environment or weather, and vehicles to take critical decisions.
Positive comments on the Dashboard have been raised, especially concerning the EO-based Fire Delineation and Burned Area and the On-demand Wildfire Nowcast and Forecast. From the comments of the Italian practitioners, one relevant pain point for adopting the Safer system is the overlap of some functions with existing services.
We noted that the Chatbot most needed and appreciated feature is the possibility to collect geo-localised reports with photos. This preference unites both operation managers and in-field agents.
Citizens tested the Chatbot voluntarily and free of charge during the demo. During the test, we had the opportunity to better identify the criticism and envisage some solutions. In particular, from the Italian pilot feedback results, we collect the elements to design a new procedure to create reports starting directly from the user input and reduce the interaction via the menu, maximizing the dialogue with the user. Another aspect we learned about, thanks to the tests, is the need to optimise the semantic level of UI. Different gaps lie in translations, but some concepts must be better expressed with labels and content explaining their meaning in the Safer system.
Additional improvements for the Beta 2 version are recorded thanks to the collected feedback such as:
- the data layer that must offer a combination of data to support the decision and monitoring tasks of complex situations
- the service continuity of social media module that is depending on the recent Twitter terms of use updates
- Reports creation of the chatbot is very complicate and the Details button is misunderstood. The procedure must thus be simplified and the steps heavily reduced.
- The procedure to share the Agent's location is too complex because users are unfamiliar with Telegram and its UI.
In order to address the raised criticisms and suggested improvements, a redesign iteration is started to define suitable user flow for the report creation and other features. To conclude, the feedback collected during the demonstration activities provides a direct impression on the maturity and operational usefulness of the ISs. Overall, the benefits are beginning to be tangible. For example, there is evidence of more immediate and timely communication between the field and the operations room.